
Demystifying Dehumidification and Drying Part 2: It’s Positively Psychrometric!
- Posted on 28th October 2020
- in Dehumidification, Dryers
- by John Real
 Welcome to Part Two of our series on Dehumidification in Dryer! If you missed Part One where we discussed why on Earth you would want to dry the drying air, check it out here.
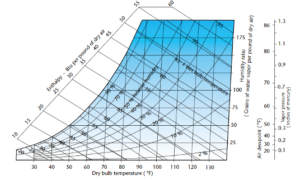
Figure 1. Psychrometric Chart. Courtesy Munters Corp.
Part Two is all about psychrometrics! If you fell asleep during that particular part of your engineering classes, psychrometrics is the “field of engineering concerned with the physical and thermodynamic properties of gas-vapor mixtures”. In this article, we are going to dive a bit into the weeds of the properties of air and how they are interrelated.
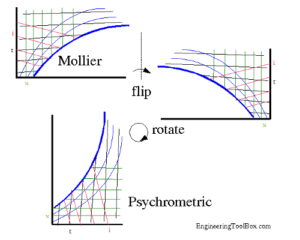
Figure 2. Mollier to Psychrometric and Back Again.
Courtesy EngineeringToolbox.com.
Here in the USA, we are used to the psychrometric chart in most applications. Our friends in the rest of the world are more familiar with the Mollier or h-x diagram. For the purposes of this article, we will use the psychrometric chart. The Mollier diagram itself is only a flip and a turn away for those more used to that configuration (which to be honest includes me as well).
The first bit of information on the psychrometric chart is the Dry-bulb Temperature. It is referred to as the dry-bulb to differentiate it from the wet-bulb temperature. This is a weird term for what we generally know as just the temperature. When a person describes the temperature, they are talking about the dry-bulb temperature. This is also known as the “sensible” temperature of the air – it is a measure of the air temperature that can be “sensed” by a thermometer. The dry-bulb temperature is displayed at the bottom of the psychrometric chart, increasing from left to right.
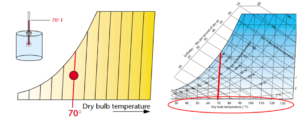
Figure 3. Dry-bulb temperature. Images courtesy Munters Corp.
The second bit of information on the psychrometric chart that everyone will be familiar with is Relative Humidity. If you have ever been lucky enough to be on the east coast of the USA during the summertime, you will be intimately familiar with relative humidity. Conceptually, relative humidity expresses the moisture content of air as a percent of what it can hold when the air is saturated. It is not, however, a measure of the absolute amount of moisture in the air – it measures the moisture contained in the air relative to the maximum value possible at a particular dry bulb temperature of the air. The maximum amount of moisture that the air can hold increases as the temperature increases, which is why relative humidity is relative. If in the morning it is 70°F and 50% relative humidity and the temperature increases to 85°F by lunchtime, the relative humidity will have dropped to 30.5% as the air can now hold more moisture. On the psychrometric chart, relative humidity is displayed as a series of curves, increasing from the bottom of the chart to the “saturation curve” which forms the left boundary. The saturation curve represents 100% relative humidity.
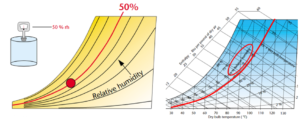
Figure 4. Relative humidity. Images courtesy Munters Corp.
Where Relative Humidity is relative, Humidity Ratio or the Specific Humidity is…specific. More specifically, Specific Humidity is the mass of water vapor per unit mass of dry air. In the USA, this is measured in grains per pound mass. There are 7,000 grains per pound mass. At 70°F and 50% relative humidity (RH) the specific humidity is 55 grains per pound (gr/lb). This means that of the 7,000 grains in our pound, 55 grains of that mass are water vapor, and the balance 6,945 grains are dry air. The psychrometric chart allows us to determine the humidity ratio or specific humidity of our air. By starting at 70°F, 50% RH point in the chart, we can read the humidity ratio by tracing a horizontal straight line to the chart’s right edge, where the scale indicates the weight of the moisture in grains per pound of dry air.
It is right about here that I typically abandon Imperial Units and shuffle over to the comfort of Système international (SI) units. Dividing the grains by 7,000 will convert the grains per pound into a true ratio fraction. Multiplying this ratio by 1,000 brings you to the safety of grams per kilogram (g/kg).
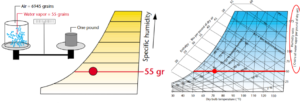
Figure 5. Humidity Ratio or Specific Humidity. Images courtesy Munters Corp.
Here is where we truly leave the familiar behind and start to enter the taller weeds of physics and the properties of air. Vapor pressure is a measure of the pressure exerted on the surrounding environment by the water molecules in the air. The amount of vapor pressure is the sum of all the pressures exerted by all of the molecules of water in the air. The unit of measure is inches of mercury – how high the water vapor can lift a column of mercury due only to its own pressure. At 70°F and 50% RH, the vapor pressure is 0.37 inches. Considering Mercury is 13.6 times heavier than water; vapor pressure can be a considerable amount of force. Enough force to peel paint from wooden siding in the wintertime. There is more moisture in the wood under the paint than in the air, so the pressure difference between the two forces paint from the surface of the wood. The vapor pressure scale is to the right of the chart and it increases linearly, just like specific humidity. Specific humidity essentially represents the number of molecules and vapor pressure sums the pressure they exert.
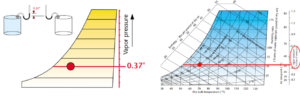
Figure 6. Vapor pressure. Images courtesy Munters Corp.
If you’ve ever pulled a beer out of a cold fridge on a hot summer day and have it start to sweat, you have firsthand experience of Dew Point. As the amount of moisture that air can hold is related to the temperature of the air, as moist air is cooled it loses the ability to hold as much moisture. At some point, the moisture will begin to condense out of the air onto any nearby surface. This point is entirely dependent on the amount of moisture in the air – the more moisture in the air, the higher the dew point temperature.
If a cold can of beer is taken out of the refrigerator at a temperature of 50°F (must be a german beer) and placed out in air at 70°F and 50% RH, the air next to the can will cool from 70° to 50°. The moisture in the air next to the can will begin to condense. When the air begins to condense, it has become saturated. Our 70°F air with 55 grains of water and 50% RH becomes saturated when cooled to 50°F – it has reached a condition of 100% relative humidity.
The left edge of the psychrometric chart is also called the saturation curve. If you draw a line horizontally to the left of our 70°F and 50% RH point it will intersect the edge of the chart or saturation curve at a temperature of 50°F. This chart also repeats the dewpoint on the right.
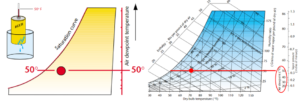
Figure 7. Dew point temperature. Images courtesy Munters Corp.
Enthalpy is an odd term for an important property, one that is especially important to drying processes. Enthalpy is a measure of total energy in the air. More specifically, it is the inner energy plus the product of volume and pressure; H = U + p*V.
When air is hot, its enthalpy is high. When air is moist, its enthalpy is also high. This is because it takes a lot of energy to evaporate moisture into the air – the more moisture in the air, the more energy necessary to heat it and then evaporator it. It takes approximately 1061 BTU to evaporator one pound of water and this energy is stored in the water vapor once it is evaporated.
Sometimes enthalpy is referred to as the sum of sensible and latent heat in the air. Latent heat is another way of expressing the amount of moisture in the air. Moisture represents the amount of heat required for its evaporation, but that heat is latent – it cannot be “sensed” by a dry bulb thermometer. On the psychrometric chart, the enthalpy scale is located to the left of the saturation curve. In our example, the enthalpy at 70°F and 50% RH is 25.4 BTU per pound of air.
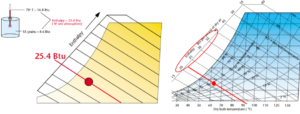
Figure 8. Enthalpy. Images courtesy of Munters Corp.
The final bit of information that can be gleaned from the psychrometric chart is Wet-bulb temperature. Where the dry-bulb temperature is measured by a dry thermometer, the wet-bulb temperature is taken by surrounding the sensor with a wet wick and measuring the reading as the water evaporates. As the water evaporates from the wick, it draws heat required for evaporation from the thermometer bulb, cooling the thermometer in proportion to the amount of evaporation. In our example, the wet-bulb thermometer is cooled from 70°F to 58.5°F by evaporation.
If the air were more saturated than 50%, it would not have been cooled so much. If the air were drier, the wet-bulb temperature would be below 58.5°.
On the psychrometric chart, the wet-bulb lines are very nearly parallel to the enthalpy lines. If we know both the wet bulb and dry bulb temperature of the air, its absolute moisture content can be found easily by using the chart.
The concept of wet-bulb is useful because it is a relatively simple and inexpensive way to measure air moisture. Also, the difference between the dry bulb and wet bulb temperatures provides a measure of the air’s drying potential. If the dry bulb is high and the wet bulb is low, the air can absorb a large amount of moisture, and it contains enough sensible heat to vaporize the water it can absorb. If both the dry and wet bulb temperatures are the same, the air is saturated and cannot absorb more moisture.
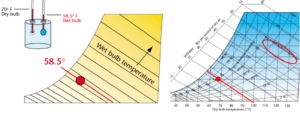
Figure 9. Wet-bulb temperature. Images courtesy of Munters Corp.
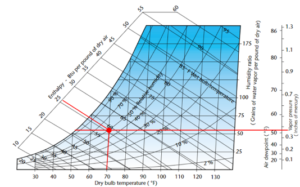
Figure 10. Putting it all together. Image courtesy Munters Corp.
Taken together, the psychrometric chart is really a potent source of data on the properties of air. The unique thing about the psychrometric chart is that if you have any two points of data about your air, you have access to all the other data points about that sample of air. This is very useful in the evaluation of drying systems and estimating the impacts of dehumidification on those drying systems. Be sure to join us for Part Three in this series in which we compare cooling and desiccant dehumidification and touch a bit on how drying is really manipulating the psychrometric properties of air.
Contact us for more information if you would like to know if dehumidification can work for your process, or for any other drying, evaporation, and thermal heat treatment questions.

John is a Process Industry Expert in Spray Drying and Evaporation, responsible for sales and business development for custom process solutions in the sanitary food, beverage, and dairy industries. John has a wide range of project execution-related experience, including, but not limited to, process engineering, system installation and commissioning support, documentation control, purchasing, and equipment quality control. His hands-on experience ensures that he seeks the best solution for our clients.
In addition, John leads a small team of engineers and designers to ensure the efficient and timely delivery of process engineering, equipment, system changes, and optimization efforts, helping our customers maximize the return on their capital investments.
Tags: Dehumidification, Dryers